

![[DIGITALE BIBLIOTHEK DER FES]](/images/digbib/d_digbib.gif)

SECTION of DOCUMENT:
[page-number of print-ed.: 80]
Denis O’Hearn *
Economic Growth and Social Cohesion in Ireland
* [School of Sociology, Queens University Belfast]
Introduction
At the end of the 1980s the future of the southern Irish economy did not look good. Economic growth was stagnant, unemployment was at a historic high and exceeded that of all other European Union countries except possibly Spain, and the state was one of the most indebted in the world. Socially, things appeared to be going from bad to worse because the state was compounding the economic miseries with an austerity programme that shut down or cut back many facilities for the poorest sections of the population.
By 1994, however, the southern Irish economy began to boom. GDP growth rates rose to 5.8 per cent and have remained at least as high since. Southern Irish per capita national income, which had been barely 60 per cent of the EU average in 1988, reached the EU average a decade later, by the late 1990s.
Table 1. Real economic growth rates in the 1990s, S. Ireland (%).
Year |
GDP |
GNP |
1991 |
1.9 |
2.3 |
1992 |
3.3 |
2.3 |
1993 |
2.7 |
3.4 |
1994 |
5.8 |
6.3 |
1995 |
9.7 |
8.2 |
1996 |
7.7 |
7.4 |
1997 |
10.7 |
9.3 |
1998 |
8.6 |
7.8 |
1999 |
9.8 |
7.8 |
Source: Irish National Income and Expenditure
Southern Irish rates of growth were so high, at least by EU standards, that a 1994 article in Morgan Stanley’s Euroletter asked, only partly tongue-in-cheek, whether Ireland was now a Celtic tiger, after the high-growth economies of East Asia (Gardiner 1994). This seemed somewhat premature at the time but as Irish growth rates rose the name stuck. It came to signify a successful economic model that other peripheral European countries might want to emulate.
[page-number of print-ed.: 81]
Sources of growth
The sources of Irish growth are debated. Most economists credit Irish success to fiscal restraint, social partnership agreements that assured pay restraint and flexible labour, the accumulation of highly educated human capital, exchange rate stability and a generally stable macroeconomic environment (European Commission 1996, Bradley 1997, O’Donnell 1998, IMF 2000). Taken one step further, the Irish case has been used to support what now appears to be the EU orthodoxy with respect to economic policy and convergence: if a country maximises the openness of its trade, gets the macroeconomics right and encourages labour flexibility it will converge. The same medicine is prescribed for the accession countries, which have even further to go than the EU periphery.
In the Irish case, at least, the correlation between macroeconomic stability and economic growth is spurious. Or, to put it more precisely, Irish economic growth was due to a very special set of (mostly exogenous) circumstances that cannot be replicated in other countries. Without those special circumstances, all the macroeconomic stability in the world could not have achieved economic growth rapid enough to promote convergence.
Irish economic growth was clearly dominated by its ability to attract investments by transnational corporations (TNCs) in a changing global environment. The US reasserted its global leadership in high tech sectors during the 1990s, particularly in computers and all the products that surround them. The expansion of IT production and the ever increasing search for new markets caused a revival of foreign direct investment by US TNCs. The attraction of the EU as a market for US high tech products increased further with the coming of the Single European Market in the 1990s. US investments in the EU rose rapidly and they tended to agglomerate in certain regions. At the beginning of the 1990s, it was unclear what the effects of such US investment would be on the EU periphery. As it came to pass, Ireland was the main beneficiary in terms of economic growth. Primarily because of its extremely low tax rates on corporate profits (ten per cent compared to 30-40 per cent elsewhere in Europe), Ireland became a key site of US investments in the EU. TNCs were also attracted by its cheap, educated, English-speaking labour force; by its low bureaucratic restrictions on foreign investors; and by a history of close relations with the Irish Industrial Development Authority (IDA). Because southern Ireland is so small (about four million people) the flow of foreign activities was sufficient to create rapid economic growth.
In 1990, at a historically high cost to the Irish state, Intel located its European site for the production of computer chips near Dublin. The cost per job was huge: more than IR£30,000 in direct grants compared to an average of IR£12,000 per job in other IDA-sponsored projects. Once tax loopholes are considered the cost could be double.
But the IDA was not just buying Intel. Nearly every major player in the computer industry followed Intel to Ireland: Gateway, Dell, AST, Apple, Hewlett-Packard and Siemens-Nixdorff in PCs; Intel, Fujitsu, Xilinx and Analog Devices in integrated circuits; Seagate and Quantum disk drives; Microsoft, Lotus and Oracle in software. Then came telesales and teleservicing for Dell, Gateway, IBM, Digital and many others. Along with these leading firms came hundreds of less well-known producers of boards, power supplies, cables, connectors, data storage, printers, networking and everything else that goes into or around computers, as well as services that are connected to or use
[page-number of print-ed.: 82]
computers. Southern Ireland’s share of foreign investment inflows into the EU tripled between 1991 and 1994, as it attracted 40 per cent of US electronics investments in Europe. A similar but smaller agglomeration of foreign pharmaceutical companies also located in Ireland.
Fixed investments by US firms, which had fallen rapidly during the 1980s, rose dramatically in the 1990s (table 2), while investments by other TNCs and Irish firms declined. As a result, the share of US-based firms in total fixed industrial investment rose from a third in 1990 to two-thirds in 1997-98. The Celtic tiger comprised two distinct stories: rising investments by US TNCs and stagnating investments by indigenous firms and other TNCs.
Table 2. Fixed industrial investments in S. Ireland by country of ownership (IR£million at constant 1990 prices), 1990-1998
Year |
US TNCs |
Other TNCs |
Irish firms |
US share of
|
Irish share of
|
1990 |
68.4 |
52.0 |
90.0 |
0.325 |
0.427 |
1991 |
109.8 |
114.6 |
71.6 |
0.371 |
0.242 |
1992 |
126.7 |
81.6 |
60.5 |
0.471 |
0.225 |
1993 |
175.5 |
62.2 |
49.1 |
0.612 |
0.171 |
1994 |
137.1 |
48.3 |
52.8 |
0.576 |
0.222 |
1995 |
157.9 |
44.2 |
56.7 |
0.610 |
0.219 |
1996 |
252.8 |
49.9 |
97.1 |
0.632 |
0.243 |
1997 |
259.0 |
51.6 |
70.3 |
0.680 |
0.185 |
1998 |
256.0 |
71.3 |
62.2 |
0.657 |
0.160 |
Source: Central Statistics Office
TNCs were directly responsible for 45 per cent of southern Irish economic growth during the first half of the 1990s, and were indirectly responsible for additional growth in construction and services. Moreover, the impact of TNCs was rising fast. Between 1995 and 1999 TNCs directly accounted for 85 per cent of economic growth in terms of their value added, and their rising profits alone accounted for 53 per cent of economic growth! Where TNCs’ value added was equivalent to 14 per cent of GDP in 1990, it rose above 50 per cent in 1999.
The effect of TNCs on economic growth was concentrated in exports of three manufacturing sectors that are dominated by US firms: chemicals, computers and electrical engineering. These three sectors alone (not including software-related services and teleservices) accounted for 40 per cent of Irish economic growth (GDP) during the 1990s, including 51 per cent in 1998, 50 per cent in 1999 and 46 per cent in 2000. They accounted for 78 per cent of industrial growth (including construction) in 1998, 85 per cent in 1999 and 84 per cent in 2000. They were the only economic sectors that exceeded the average GDP growth rate of 6.3 per cent during the 1990s, together growing annually by about 15 per cent. Even a single product could have a large effect on Irish economic growth, as was the case in 1997/98 when Pfizer introduced its Irish-
[page-number of print-ed.: 83]
produced drug Viagra onto the world market and ‘Irish output’ of organic chemical products rose by 70 per cent (CSO 2001).
This contribution to economic growth, however, was not even remotely matched in terms of the three sectors’ contribution to employment growth. In 1999, the sectors accounted for a mere 0.7 per cent of employment growth and in 2000 only 6.2 per cent. Employment growth has instead been concentrated in services, contributing to the rise of inequality (including wage inequality) that is discussed, below.
Foreign Direct Investment and the GDP-GNP-Gap
The extreme relationship between Irish economic growth and the growth of foreign investments created a number of unique characteristics that set off the Irish economy from other economies of the EU, including the EU periphery.
A gap opened up between GDP and GNP. Ireland is unique in Europe in the degree that its gross domestic product exceeds its gross national product because of the profits that are removed by TNCs. In 1983, foreign profit repatriations made up just 3 per cent of GDP. By 1995, they were nearly 19 per cent of GDP. In 1999, they had risen to an astounding 40 per cent of GDP (48 per cent of incomes from royalties and licenses are included)! The proportion of TNC profits in GDP began to rise by an astonishing extent after 1997. In 1998, growth of foreign profits was equivalent to eighty per cent of economic growth! During the years 1997-99, the rise of TNC profits was equivalent to two-thirds of economic growth. As a result, the gap between GDP and GNP widened. In 1980, southern Irish GNP and GDP were practically equal. In 1990, gross domestic product was 11 per cent higher than gross national product. Today GDP exceeds GNP by about 20 per cent. In simple language, GDP overstates by a fifth how much material wealth was created for the Irish people by their own economic activities.
Arguably, Ireland’s most important function today is as a site where US companies can shift their products into Europe, while accumulating profits in order to avoid taxation. Significant profit shifting through transfer pricing is indicated by inexplicably high TNC profit rates, output growth and rises in labour productivity in the sectors most prone to profit shifting. According to the US Department of Commerce’s Survey of Current Business, US TNCs located in Ireland maintained profit rates in the 1990s that were five times greater than they receive elsewhere in the world (up from 2 ½ times higher in the 1970s). These uncommonly high TNC profit rates were accompanied by rapid output growth beyond what would have been expected from their rates of investment.
The indigenous economy: following the European path?
Has this rapid growth of the foreign sector spun off into indigenous sectors? O’Malley (1998) argues that a dynamic indigenous manufacturing sector has grown alongside the foreign sector. Others contend that TNCs today are more strongly linked to indigenous industry than during previous expansions (Barry et al. 1999, Ruane 1999).
[page-number of print-ed.: 84]
Ó Riain (1999) argues that there were ‘two globalisations’ in Ireland in the 1990s. One was the outward movement of US capital through Ireland and into Europe. The ‘second globalisation’ was the development of a dynamic and globally oriented Irish indigenous segment, led by Irish entrepreneurs who were ‘globalised’ by their connections with TNCs in the information technology sectors in places like California’s Silicon Valley. Ó Riain credits this Irish success to the flexible developmental policies of the Irish state, which combined a neoliberal macroeconomic environment with everyday micro-intervention to identify opportunities for local entrepreneurs.
In reality, these optimistic accounts of a recent indigenous revival are overstated. The Irish state limited its pressure on TNCs to link locally because stronger intervention would have undermined the basic attractiveness of Ireland as a deregulated, hands-off state. In 1996, out of 2,667 indigenous firms that employed ten or more, only 174 were sub-suppliers to TNCs, mostly providing routine supplies like packaging and printed materials (Breathnach and Kelly 1999). The proportion of raw materials that were purchased locally by TNCs hardly rose at all during the 1990s, from 18.8 per cent in 1990 to 19.1 per cent in 1996. If we account for the fact that two-thirds of ‘local purchases’ in the electronics sector actually consisted of one TNC subsidiary buying from another (Forfas 1997), then TNCs were buying a substantially smaller share of their material supplies from Irish firms as the Celtic tiger developed.
The only place where Ó Riain’s second globalisation appears to be significant is software. Thousands of engineers and technicians who qualified in Ireland but emigrated, and others who stayed in Ireland but became dissatisfied with their TNC employers, made up a pool of potential entrepreneurs with knowledge of the software industry and eager to set up as small employers. They did so in record numbers during the 1990s. By the year 2000, Ireland was the second largest exporter of software behind the US, having surpassed Israel and India. Half of the employment in software was in indigenous Irish firms. Nearly 80 per cent of Irish software companies exported some of their product and nearly half exported most of their product (Forbairt 1996). Yet 82 per cent of these firms had no alliances of any kind with TNCs (Ó Riain 1999).
Weaknesses in the indigenous software sector, however, raise questions about its long-term sustainability. The industry is dominated by TNCs in every respect except employment. With half of software employees, TNCs account for 87 per cent of Irish software sales, 92 per cent of software exports from Ireland and 89 per cent of software revenues. Microsoft alone accounted for 40 per cent of exports in 1995 (Forbairt 1996). Indigenous software firms are mostly very small, with average employment less than fifteen. Their levels of R&D are ‘worryingly’ low and expenditure on training actually fell during the 1990s (Lucey 1996). This indicates that Irish software, like the rest of the economy, is essentially dualistic—highly developed TNC giants alongside a scattering of very small and vulnerable domestic firms. The Irish software sector ‘cannot bear the burden of the huge expectations which have been placed on [it]’ (O’Riain 1997, p.24).
Overall, the sustainability of Irish indigenous industry had become very questionable by the end of the 1990s. Table 3 shows the shares of corporate profits that went to TNCs and Irish companies between 1990 and 1999. While the rise of TNC profits was spectacular, the indigenous share of profits fell from 51.5 per cent in 1990 to less than ten per cent in 1999. More importantly, indigenous profits fell in absolute terms. In
[page-number of print-ed.: 85]
1999, indigenous companies received only two-thirds of the profits they received in 1990, and the fall was much greater in real terms. This was reflected in a sharp rise in the numbers of company failures during 1999-2000 (Canniffe 2000).
Table 3. Corporate profits received in southern Ireland by country of ownership, 1990-1999 (million IR£, current prices)*
Year |
TNC
|
Irish corporate
|
Total corporate
|
TNC shareof
|
1990 |
2608 |
2764 |
5372 |
0.485 |
1991 |
2538 |
3053 |
5591 |
0.454 |
1992 |
3042 |
3014 |
6056 |
0.502 |
1993 |
3355 |
3793 |
7148 |
0.469 |
1994 |
3787 |
3715 |
7502 |
0.505 |
1995 |
4193 |
5524 |
9717 |
0.432 |
1996 |
5826 |
4408 |
10234 |
0.569 |
1997 |
7382 |
5458 |
12840 |
0.575 |
1998 |
12078 |
3332 |
15410 |
0.784 |
1999 |
16249 |
1794 |
18043 |
0.901 |
Source: National Income and Expenditure, Balance of International Payments
* Profits do not include royalties and license fees.
This duality between a rapidly growing foreign sector and a stagnant indigenous one is shown most clearly in productivity figures for the 1990s. Output in the three US-dominated sectors of computers, electrical engineering and chemicals grew by 375 per cent during 1990-1999 while employment grew by only 73 per cent. Thus, output per employee grew by 215 per cent, nearly nine per cent annually. Elsewhere in the economy —mainly Irish-owned services, construction and basic manufactures—output rose by just 55 per cent while employment grew by 40 per cent. Output per employee grew by about one per cent annually. By 1999, the average worker in the foreign sector produced nearly eight times more output by value than did the average worker in the rest of the economy (CSO, National Income and Expenditure, various years; and CSO, Labour Force Estimates, various years).
Growth with Inequality
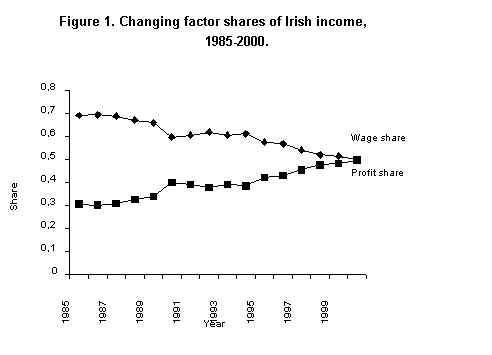
Celtic tiger growth encouraged a large rise in unearned incomes and professional fees, much of which was invested abroad by the richest segments of society. Rapidly rising outflows of profits to TNCs, combined with inflows of profits to the upper strata of the Irish population, created a dynamic of class inequality that was unknown in Ireland before the 1990s. Before 1987, factor shares of non-agricultural income were relatively stable, with wages accounting for 70 per cent and profits 30 per cent. Thereafter, factor incomes began to shift rapidly in favour of profits. By 2000, for the first time in the history of the southern Irish state, the profits share from non-agricultural activities were virtually equal to the wage share (Figure 1).
[page-number of print-ed.: 86]
Factor income inequality was accompanied by increased income inequalities including wage inequality. Before the 1990s, the removal of vast amounts of wealth ironically tended to dampen social inequality in Ireland because the class that received most incomes from economic growth was foreign capital, whose incomes did not show up in the Irish income distribution. During the 1970s and early 1980s individual incomes became slightly less unequal (O’Hearn 1989).
New trends of the late 1980s and 1990s increased income inequality. The Irish labour market became more segmented during the growth phase of the 1990s, with a clear distinction between core and peripheral jobs. Peripheral jobs, more often filled by women in services who often work part-time or on a fixed contract, were relatively low paying. Core jobs and especially professional positions, more often filled by highly educated men, were higher paying. Economic growth created few new jobs before 1994, but thereafter employment grew rapidly. The numbers at work grew by a third between 1994 and 1999. But manufacturing, the centre of TNC-led economic growth, created just 39,000 new jobs while mostly low-paid service employment grew by 293,000. In other words, economic growth was mainly in TNC manufacturing while employment growth was mainly in local services. Even within industry, between a third and a half of new TNC workers were part-time or temporary contract workers, and most new employees were still routine production line workers rather than the high tech engineers that became the public image of the ‘Celtic tiger’.
As labour market segmentation became more pronounced, individual income distributions became more unequal. The available data show that both wages and personal incomes became more unequal after 1987. The disposable incomes of the top 40 per cent of households grew twice as quickly as the bottom 40 per cent. In terms of the ratio of the income share of the richest ten per cent to the poorest ten per cent, Ireland is now the most unequal country in Europe, second only to the United States in the OECD (UN 2001, p. 182).
[page-number of print-ed.: 87]
One reason for rising inequality was rising wage inequality (Table 4). Nolan and Hughes (1997, p.4) found that ‘from 1987 to 1994 there was a consistent widening in dispersion for both weekly and hourly earnings, particularly at the top of the distribution’. In terms of hourly earnings, the average wages of the bottom quarter fell from 73 per cent of the median income in 1987 to 68 per cent in 1994. Average earnings for the top decile, on the other hand, rose from 196 per cent of the median income in 1987 to 224 per cent in 1994, a rather astonishing increase in a period of just seven years (Nolan and Hughes 1997, p.5). Earnings became more unequal both for men and women, and for both younger and older employees. Barrett et al. (1999, p. 84) show that the increase in earnings dispersion (ratio of the top to bottom decile) was greater in Ireland than anywhere else in the OECD.
Rising inequality was directly connected to the nature of economic growth in the 1990s. Growth created some jobs for skilled and semiskilled operatives in manufacturing, but many more for service and commerce workers with low pay. Three-quarters of low pay was accounted for by skilled and semiskilled workers in manufacturing, clerical workers, service workers and employees in commerce, insurance and finance (Nolan and Hughes 1997, p.10). The proportion of southern Irish employees on low pay rose from 20 to 24 per cent between 1987 and 1994 (Nolan and Hughes 1997, p.7), compared to 12-13 per cent in the rest of the EU except Scandinavia, where 5-6 per cent of workers were on low pay. Relative poverty increased along with inequality, and the Irish poverty rate rose to become the highest in the EU, with 15.3 per cent of the population living in poverty (UN 2001).
Table 4. Distribution of earnings in Ireland, 1987 and 1994 (proportion of median)
1987 |
1994 |
|
All employees, hourly earnings | ||
Bottom decile
|
0.47
|
0.47
|
All employees, weekly earnings | ||
Bottom decile
|
0.41
|
0.34
|
Full-time employees, weekly earnings | ||
Bottom decile
|
0.50
|
0.48
|
Source: Barrett et al. (1999), p.82.
This rising level of inequality and relative poverty during a period of rapid growth was not effectively countered by state policies. Indeed, the overriding ideological position of the 1990s in Ireland was that growth was the result of neoliberal policies, including
[page-number of print-ed.: 88]
privatisation and ‘responsible’ fiscal policies. Successive state budgets have favoured tax cuts for the rich and failed to provide the necessary social spending to correct Ireland’s severe social problems. Thus, many social services have run down. Most notably, a populist social housing regime that provided affordable and reasonable housing to successive generations of low-income households broke down. Irish citizens no longer have assured access to affordable housing (Fahey 1999). In health, only three EU member states reduced spending as a proportion of GDP between 1980 and 1996. Ireland’s reduction, 20 per cent, was easily the largest of the three. Irish public health spending per capita as a percentage of the EU average remained around 70 per cent, despite Ireland’s rapid growth. Even after an increase in health spending in 1998, Ireland still ranked 20th in a survey of 27 OECD countries (Wren 2000b). Between 1970-75 and 1995-2000, Ireland’s global ranking with respect to life expectancy at birth fell by seven places (UN 2001, p. 141). Finally, in the field of education Ireland has performed poorly, in spite of the public image that growth is due to a highly educated population. Almost 23 per cent of the population are functionally illiterate, easily the highest level in the EU. Yet in the late 1990s, Ireland ranked last in the OECD in terms of investment per pupil as a proportion of per capita GNP.
Conclusions
If the 1980s in Ireland appeared to confirm the predictions of critical development theories, that peripheral areas are most unlikely to develop industrially while still dependent on TNCs, the 1990s appeared to show the opposite. Ireland developed industrially and attained upward mobility within Europe by attracting TNCs from key innovative sectors. Southern Irish growth was high and consistent. Some experts predict that it could continue for another decade (O’Leary 2000). If so, Irish per capita output will not only match the EU average, it could even reach the very top of the EU.
Ireland is thus a showcase of a new kind of neoliberal development. The IMF’s consultation report for 2000 cites Ireland as a ‘spectacular’ example of the positive results that come from ‘sound and consistent macroeconomic policies, a generally flexible labour market, a favourable tax regime, and the long-standing outward orientation of Ireland’s trade and industrial policies’ (IMF 2000, p. 2). It called on Ireland to further tighten its fiscal policy, to keep holding the line on wages and to increase its programme of deregulation and privatisation. This was widely reported by the Irish press as ‘vindication’ of the Irish Finance Minister’s strict neoliberal policies of wage and fiscal restraint (Suiter 2000). It was practically a universal conclusion among conventional economists and officials that wages and spending must be constrained for fear of ‘overheating’ the economy and making it ‘uncompetitive’.
Ironically, then, Irish economic growth and convergence comes at a high price. The neoliberal policies that are considered necessary to feed the Celtic tiger have assured deepening social exclusion and inequality, while state policy is unable to tackle urgent social problems like housing, health and education.
Meanwhile, extreme dependence on US investments raises new concerns about the sustainability of economic growth as that economy slips into stagnation. Most economists have been optimistic that the southern Irish economy is in for a ‘soft
[page-number of print-ed.: 89]
landing’ (Barry and Bradley 1997, Krugman 1997). But a repeat of US disinvestments as happened in the 1980s could create another, possibly even deeper, period of recession and decline.
Perhaps Irish growth is sustainable, albeit with undesirable social consequences. This is yet to be seen, and was called into question by the closure of Gateway and other major TNCs in Ireland in the summer of 2001, and large employment cutbacks in others such as Xerox. Even if it is sustainable, however, it is highly questionable whether the Irish model can be generalised. Countries on the EU periphery, in Eastern Europe and further afield look to Ireland as a model of successful development. Yet southern Ireland ‘succeeded’ because it attracted up to a fifth of US manufacturing investments into the EU (40 per cent of high tech sector investments) with just one per cent of the EU population. Next door, Britain attracted two-fifths of total foreign investments into the EU but with twenty times as many people. It hardly became a ‘tiger’ for doing it. The same limitations of the TNC-led model hold for Spain, with ten times more people than Ireland, or even Portugal, with triple the population. Moreover, other countries will find it hard if not impossible to follow the Irish path simply because there is not enough foreign investment available to sustain growth in more than one or two peripheral European zones.
As the limitations of Irish-style neoliberal development become clearer, countries that seek convergence with North America and the European core may desire a return to development models based on more balanced (including indigenous) growth, with more interventionist and regulatory forms of developmental state. There is still a strong case that countries seeking to achieve rapid increases in wealth and technical upgrading are more likely to do so through strategies of creative imbalance rather than through the conservative economic orthodoxy of macroeconomic balance and stability (Hirschman 1958). And there is compelling historical evidence that the richer industrial countries of the European core achieved their wealth by selectively protecting key sectors to build their competitive advantage so that they could become world-class exporters (Senghaas 1985). A similar experience came from East Asia in the last half of the twentieth century (Amsden 1989, So and Chiu 1995). Perhaps we should be asking whether the EU ‘convergence’ and ‘accession’ countries are being denied the very tools they need to achieve convergence.
References
Amsden, A. (1989), Asia’s Next Giant: South Korea and Late Industrialization, Oxford, Oxford University Press.
Barrett, A., T. Callan and B. Nolan (1999), ‘Rising wage inequality, returns to education and labour market institutions: evidence from Ireland’, British Journal of Industrial Relations, 37:1, 77-100.
Barry, F., J. Bradley and E. O’Malley (1999), ‘Indigenous and foreign industry: characteristics and performance’, in F. Barry (ed.), Understanding Ireland’s Economic Growth, London, Macmillan.
Barry, F. and J. Bradley (1997), ‘FDI and trade: the Irish host-country experience’, Economic Journal, 107:445, 1798-1811.
Bradley, J., J. Fitzgerald, P. Honohan and I. Kearney (1997), ‘Interpreting the recent Irish growth experience’, in D. Duffy et al., Medium-term review: 1997-2003, Dublin, Economic and Social Research Institute.
[page-number of print-ed.: 90]
Breathnach, M. and D. Kelly (1999), ‘Multinationals, Subcontracting Linkages and the Innovative Performance of Indigenous Firms: Some Irish Evidence’, paper delivered to European Network on Industrial Policy International Conference, Dublin, 9-10 December
Caniffe, M. (2000), ‘Company failures up 65% in second quarter 2000’, Irish Times, 14 July.
CSO (2001), National Income and Expenditure: First Results for 2000, Dublin, Central Statistics Office.
European Commission (1996), The Economic and Financial Situation in Ireland, special issue of European Economy, Brussels, European Commission.
Fahey, T. (1999), Social Housing in Ireland: a Study of Success, Failure and Lessons Learned, Dublin, Oak Tree Press.
Forbairt (1996), National Software Directorate Irish Software Industry Survey 1995: Results, Dublin, Forbairt.
Forfás (1997), ‘Optimising Purchasing Linkages in the Irish Economy’, mimeo, Dublin, Forfás.
Gardiner, K. (1994), ‘The Irish Economy: a Celtic Tiger?’ Ireland: Challenging for Promotion, Morgan Stanley Euroletter (1 August), 9-21.
Hirschman, A. (1958), The Strategy of Economic Development, New York, W. W. Norton.
IMF (2000), ‘IMF concludes Article IV consultation with Ireland’ Public Information Notice No. 00/61 (10 August).
Krugman, P. (1997), ‘Good news from Ireland: a geographical perspective’, in Alan Gray (ed.), International Perspectives on the Irish Economy, Dublin, Indecon.
Nolan, B. and G. Hughes (1997), ‘Low pay, the earnings distribution and poverty in Ireland’, working paper no. 84, Dublin, Economic and Social Research Institute.
O’Donnell, R. and D. Thomas (1998), ‘Social partnership in Ireland, 1987-1997’, paper presented to seminar on Social Partnership in Western Europe, Cardiff, 11-13 September.
O’Hearn, D. (1989), ‘The Irish case of dependency: an exception to the exceptions?’ American Sociological Review, 54:4, 578-96.
O’Hearn, D. (1998a), Inside the Celtic Tiger: The Irish Economy and the Asian Model, London: Pluto.
O’Leary, J. (2000), ‘New economic traffic heading to Ireland’, Irish Times, 4 August.
O’Malley, E. (1998), ‘The revival of Irish indigenous industry 1987-1997’, in Quarterly Economic Commentary, April, Dublin, Economic and Social Research Institute.
Ó Riain, S. (1997), ‘The birth of a Celtic tiger’, Communications of the ACM, 40:3, 11-16.
Ó Riain, S. (1999), Development and the Global Information Society, Ph.D. dissertation, University of California Berkeley.
Ruane, F. (1999), ‘Whither Ireland’s industrial policy?’ paper delivered to conference of the European Network on Industrial Policy, Dublin, 10 December.
Senghaas, D. (1985), The European Experience, Leamington Spa, Berg.
So, A. and S. Chiu (1995), East Asia and the World Economy, Thousand Oaks CA, Sage.
Suiter, Jane (2000), ‘McCreevy vindicated by IMF’, Irish Times (11 August).
United Nations Development Council (2001), Human Development Report 2001.
Wren, M. (2000a), ‘Relative poverty deepens despite Celtic Tiger’, Irish Times, May 19.
Wren, M. (2000b), ‘Health system needs urgent funding’, Irish Times, October 3.
© Friedrich Ebert Stiftung | technical support | net edition fes-library | März 2002