

![[DIGITALE BIBLIOTHEK DER FES]](/images/digbib/d_digbib.gif)

SECTION of DOCUMENT:
[page-number of print-ed.: 16 (continuation)]
3. FINDINGS OF THE EVALUATION
The analysis and interpretation of the findings of the evaluation have been closely aligned with the terms of reference of this study (Appendix I). Consequently, the findings are divided into four broad subheadings, namely: the general profile of programme farmer beneficiaries, the impact of programme inputs on crop productivity, the effects of the programme on technology adoption among the smallholder farmers, and the efficiency of the programme in input targeting, management and distribution.
It must also be observed that some of the findings have been discussed under the introduction above where they were considered necessary in providing the background to the evaluation report.
3.1 The General Profile Of Programme Beneficiaries
One of the crop pack programme objectives is to "Assist the smallholder farmers to recover from the adverse effects of the
[page-number of print-ed.: 17]
drought". This makes all the government estimated 1,2 million smallholder farmers eligible for the inputs under this programme. The distribution of the inputs therefore covered the whole spectrum of the smallholder farmers. But some view feels that the programme should be directed to resource poor smallholder farmers only and not to everybody. A second view holds that the programme must be open to the resource rich farmers who can make optimal use of the donated inputs. The second view sounds like the parable of the talents. A third view maintains that the programme should not be open to those households whose heads are fully employed in the formal sector elsewhere. An analysis of respondents' personal data, their status and ownership of farming resources reveals an interesting picture.
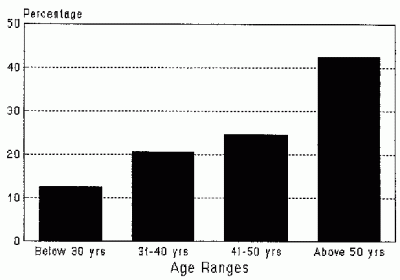
Out of the 602 farmers interviewed nearly 68 percent were male respondents. This was rather surprising as it is a widely held view that women dominate smallholder agriculture. But perhaps this shows one thing: that where decisions are required men would always come forward while women remain in the fields. As far as marital status is concerned an overwhelming majority of smallholder farmers are married, scoring some 86 percent of respondents. Figure 3.1 shows a fair age distribution of respondents, with 42,5 percent being above 51 years of age. This age distribution pattern shows that nearly 60 percent of the smallholder working farming population is below 50 years of age. Such an age pattern provides an encouraging future for the agricultural industry as it shows that agriculture within the smallholder sector is run by a fair proportion of able-bodied people. But it must be noted that these people are respondents to the questionnaire and not necessarily heads of households. Table 3.1 depicts that respondents consist of a wide range of all sorts of relationship patterns to the actual households.
[page-number of print-ed.: 18]
Figure 3.1.: Age Distribution of Respondents
Source: Evaluation Data, 1997
[page-number of print-ed.: 19]
TABLE 3.1: Relationship Patterns Between Respondents and household Heads (N=602)
|
RESPONDENTS RELATIONSHIP |
PERCENTAGE |
|
Self Wife Son Daughter Father Mother Other Relations Worker |
59.0 24.1 5.0 2.2 4.2 2.3 2.2 1.2 |
SOURCE: Research data, 1997
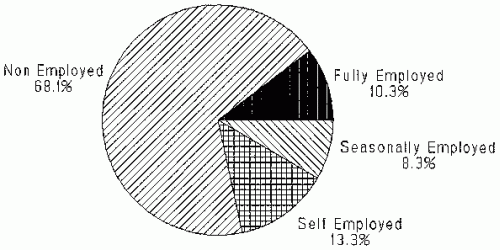
Like the Resettlement Programme, the crop pack programme was not meant to benefit households with heads in full time employment. But an analysis of Figure 3.2 shows that slightly over 10 percent of household heads are in full time employment, while 8 percent and 13 percent are seasonally employed and self employed respectively. Those who are fully committed to smallholder farming constitute 68 percent.
This distribution pattern shows that the programme is benefiting or has benefited most of the people it is intended. The people who are in some form of employment which enables them to earn some income can afford to procure their own inputs. But as most programmes involving human beings it seems difficult to completely eliminate people who are not supposed to benefit. The reasons are many and varied; they will be discussed elsewhere below.
[continue reading on page 21]
[page-number of print-ed.: 20]
Figure 3.:2: Distribution of Employment
Source: Evaluation Data, 1997
[page-number of print-ed.: 21]
The investigation divided the programme beneficiaries into four farming status categories, namely: advanced master farmers, ordinary master farmers, master farmer trainees and non-master farmers. Nearly half of the beneficiaries (49%) are non-master farmers, a fact which seems to refute the allegations that Agritex staff appear to favour their master farmers in the allocation of crop packs at the exclusion of non-master farmers. Table 3.2 shows that only 7,5 percent are advanced master farmers.
TABLE 3.2: Farmers' Status (N=602)
|
STATUS |
PERCENTAGE |
|
Advanced Master Farmers Master Farmers Master Farmer Trainees Non-Master Farmers |
7.5 21.8 21.3 49.4 |
SOURCE: Research data, 1997
If this is a reflection of the structure of the whole smallholder agricultural sector it seems that the agricultural extension institution has a long way to go in providing training among the smallholder farmers. It, however, seems clear that the crop pack programme is open to every farmer, irrespective of his/her status in the smallholder sector.
Over 50 percent of the farmers interviewed own at least one, or two mould board ploughs (70.7%), wheelbarrows (56.6%) and scotch carts (52.2%), while between 40 and 50 percent own one or two cultivators (46.3%) and harrows (40.7%). Thirty-six percent of the farmers own
[page-number of print-ed.: 22]
between 4 and 6 working hoes. Only a small minority of farmers responded that they own one or two planters (13.3%) one or two working tractors (6.1%) and at least one sheller (4.2%). These were mainly small scale commercial area farmers. This pattern of ownership reveals that most of the smallholder farmers own at least the basic farm implements, tools and equipment. The impact of the crop pack programme on the performance of the smallholder farmers cannot have been constrained by lack or inadequacy of farm implements, tools and equipment.
An analysis of livestock ownership, particularly cattle and donkeys, shows that 26 percent of the farmers own no cattle, while 74.4 percent own no donkeys. Forty-two (42%) percent of the small holder farmers own between one and ten herd of cattle and another 15 percent own between 11 and 20 herd of cattle, while 21 percent own between 1 and 6 donkeys. Nearly 32.5 percent own no cattle draft power, and 64 percent own between 2 and 10 draft cattle; while a small percentage of 18.5 own between 2 and 6 draft donkeys, and 74.4 percent own no donkeys for traction purposes. Such distribution patterns of draft livestock provides serious constraints in the tillage of fields among smallholder farmers. As a result, 58.3 percent use owned animal power for ploughing, while 12.1 percent use hired draft animals for this purpose, and nearly 4 percent use their own tractors; these are mainly from small scale commercial areas. The rest, as shown on Table 3.4, either borrow animals, or hire tractors and/or use a combination of two of the above methods.It is worth noting that a sizeable percentage of 5 uses hand hoes for land preparation purposesThe distribution of the crop packs has not discriminated on the basis of permanent and/or reliable draft power availability. The packs have been allocated to everyone farming in the small holder sector. It is pertinent to note that the crop packs have not been wasted because of lack of permanent and/or reliable draft power: the farmers were able to apply one or a combination of two methods to plough their fields.
An examination of small stock - goats, sheep, pigs and poultry -ownership by smallholder farmers seems to indicate mixed experiences, with goats being owned by over 65 percent of the farmers, sheep by about 15 percent, pigs by only 9 percent, and poultry being owned by over 90 percent of smallholder farmers.
[page-number of print-ed.: 23]
TABLE 3.3: Methods used for Ploughing. (N = 602)
|
METHOD |
PERCENTAGE |
|
Owned draft animals Hired draft animals Borrowed draft animals Owned tractor power Hired tractor power Use of hand hoes Combination of 1 and 5 Combination of 2 and 5 Combination of 1 and 6 Combination of 2 and 6 |
58.3 12.1 3.8 3.7 1.2 5.0 10.0 1.7 1.3 2.2 |
SOURCE: Research data, 1997
This helps to explain the source of income used for additional inputs for smallholder farming operations. From the sale of their small stock they are able to hire draft power and to procure more chemicals as discussed below.
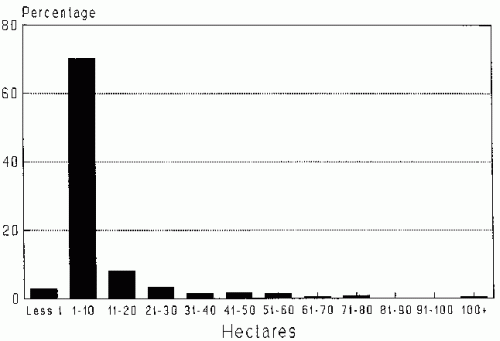
The results of the interviews, as depicted on Figure 3.3 and Table 3.5 below show that slightly over 80 percent of the smallholder farmers own and till between 0.2 ha and 20 hectares, with an overwhelming majority (70%) owning and/or operating between 1 and 10 hectares. It is also noted that only two farmers in the research sample own and operate over 100 hectares; these again are in the small scale commercial area. The size of arable land holdings among peasant farmers is important in the adoption of new farming technologies. The small arable land holdings constrain them from enterprise diversification because they cannot afford to experiment with new innovations lest they fail. As a result, the impact of the crop pack programme cannot be easily assessed as one of the factors of production is in short supply.
[continue reading on page 25]
[page-number of print-ed.: 24]
Figure 3.3: Arable Land Distribution]
Source: Evaluation Data, 1997
[page-number of print-ed.: 25]
It should therefore be appreciated that the poor technological adoption among smallholders cannot wholly be attributed to peasant conservatism but also, and more so, to rational economic calculations of the risks involved in experimenting within small, and sometimes fragmented plots of arable land.
Table 3.4. Arable Land Distribution.
|
Arable land ownership range (Ha) |
Percentage |
Less than 1 |
2.8 |
Between 1 and 10 |
70.1 |
Between 11 and 20 |
8.1 |
Between 21 and 30 |
3.3 |
Between 31 and 40 |
1.4 |
Between 41 and 50 |
1.6 |
Between 51 and 60 |
1.5 |
Between 61and 70 |
0.4 |
Between 71 and 80 |
0.7 |
Between 81 and 90 |
0.0 |
Between 9 and 100 |
0.0 |
Above 100 |
0.4 |
Source: Evaluation Data, 1997.
3.2 The Impact Of The Inputs On Crop Productivity
The Ministry of Agriculture intended the crop pack programme to encourage smallholder farmers to increase their agricultural productivity through the adoption of improved seed, fertilizer and appropriate tillage services. The importance of improving productivity, cannot be over-emphasized in the Zimbabwean economy which is agriculturally based. It is therefore crucial for the evaluation to assess the impact of the programme inputs on crop productivity. To do this the evaluation had to investigate general trends in hectares under crop production to see if there
[page-number of print-ed.: 26]
is any evidence for areal expansion in cropping activities. The evaluation also investigated trends in levels of selected crop yields whether they are increasing or decreasing after the introduction of new technologies through the crop pack programme. Patterns in crop sales were also regarded as important indicators of improved crop productivity. Productivity in this evaluation is therefore understood to refer to discernible increases, in absolute terms, in expansion of cropping area and in global yields and sales of selected crops, and not to the traditional economic definition of productivity per unit factor of production. So the questionnaire was designed to collect data relevant to these issues.
Some 89 percent of all the farmers interviewed reported that the crop pack inputs have been of immense benefit to their cropping programmes, and only 9 percent responded in the negative. The evaluation was curious to know why they had not benefited. Most of these farmers explained, as extensively discussed elsewhere below, that the inputs have always been distributed late in the farming season and others said that the inputs did not help them much because they had insufficient arable land for the additional seeds, fertilisers and crop chemicals. A few others also explained that the inputs were inappropriate for their requirements and conditions.
The farmers were also asked whether the inputs from the government had improved their crop yields. Some 88.5 percent responded positively, while 11.3 percent felt the inputs had not improved their yields. But they could not explain why. The interviewees were further asked whether the inputs had improved their crop sales. Some 64.5 percent stated that the government crop pack inputs were responsible for the increase in their crop sales. But the remainder (35.4%) indicated that the inputs had not improved their crop sales because of the mistiming of the arrival of the inputs, lack of draft power, and shortage of suitable arable land. The evaluation, however, considers that lack of improvement in crop yields and crop sales is also a result of sheer poor performance among some smallholder farmers.
In order to corroborate the above claims the evaluation went further to try and statistically quantify the temporal variations in
[page-number of print-ed.: 27]
the area under crop production/cultivation, in crop yields and in crop sales for selected crops during two seasons. The seasons chosen were the most recent ones - the 1994/95 and the 1995/96 seasons.
These seasons were chosen in accordance with the law of recency in order to ensure that the farmers would remember their production and sales records. Table 3.5 shows seasonal variations, in percentage terms, of the area under cultivation, of yields and sales, in tonnes, of major crops distributed under the government drought relief programme. A detailed analysis of the emerging patterns reveals certain discernible variations from which some definitive generalisations can be inferred with regards to all the three main variables - i.e hectarage, yields and sales - for most of the commodities selected. It is noted that the hectarages for maize expanded from 1994/95 to 1995/96 by some 17 percent; millet and sunflower increased, during the same period by 17.8 percent and 2.6 percent respectively. But the hectarages for sorghum and groundnuts substantially decreased in that period. There were increases in yields for maize (48%), millet (50%) and groundnuts (43%) while sorghum registered a marked decrease of some 22 percent, and sunflower maintained its production level during the two seasons. The sales of all but sorghum recorded remarkable increases between 1994/95 and 1995/96 with millet registering well over 100 percent and maize 61 percent.
It seems difficult, and perhaps even dangerous, to state categorically that the increases observed were due to the impact of crop pack inputs from observations made on only two seasons. It must be admitted that other factors - such as rainfall variability between the two seasons, timing of the inputs, improved availability of draft power, etc - might have been responsible for the observed differences. But that there were increases is an interesting phenomenon. It can be argued that the availability of free inputs to drought-stricken farmers, who might have been short of income to procure the necessary inputs, can only but improve their capacity in expanding their crop hectarages, and increasing their yields and sales. These increases show that the inputs have impacted positively on the farmers' productivity and overall performance. It is also pertinent, as shown on Table 3.6, to state that the majority of
[continue reading on page 29]
[page-number of print-ed.: 28]
TABLE 3.5. CROP PRODUCTIVITY ( N = Various)
[page-number of print-ed.: 29]
the respondents, involved in the cultivation of three (i.e maize, groundnuts and sunflower) of the five crops of the crop pack programme, have indicated that they are self-sufficient in the production of those crops.
But the sorghum and millet producers responded that they were not self- sufficient in these crops. However, in the absence of any information to the contrary, it can tentatively be concluded that the government agricultural relief inputs are responsible for the observed increases in crop production within the smallholder farming sector.
TABLE 3.6: Self - Sufficiency in the Production of Selected Commodities
Crop |
Positive |
Negative |
No |
Maize Sorghum Millet Groundnuts Sunflowers |
60% 5.8% 5.2% 12% 3.2% |
26.9% 10.0% 6.0% 10.1% 1.8% |
13.1% 84.2% 88.9% 77.1% 95.0% |
SOURCE: Research data, 1997
3.3 Effects of the Programme on Technological Adoption
A hopeful proposition of the crop pack programme is that it exposes farmers to new technologies. Further it is assumed that ultimately farmers are attracted by the performance of these technologies, so that they adopt them. Before examining the evidence of farmers' adoption, it is important to discuss the scope of the programme, whether it is widespread among selected respondents.
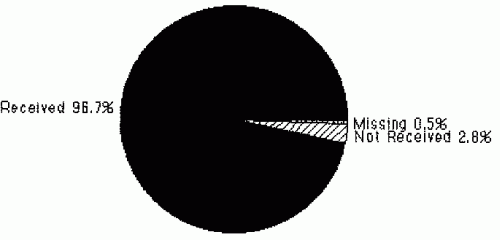
Figure 3.4 shows that the programme is considerably widespread among respondents.
[continue reading on page 31]
[page-number of print-ed.: 30]
Figure 3.4.: Proportion of People Receiving Inputs
Source: Evaluation Data, 1997
[page-number of print-ed.: 31]
Nearly everybody in the sample knows and participates in the programme. Only 17 people (2.8%) said they are not taking part in the programme. Almost all of these farmers (2.8%) may be gainfully employed, which is the main reason why they do not take part in the programme. The rest of the farmers - 96.2% - participate in the programme. It seems therefore that the programme distributes packs to most of the households. To date the programme has poured some 392157 tonnes of seed packs and chemicals to farmers all totalling about Z$756 million.
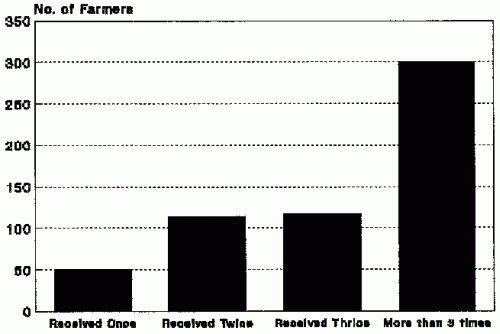
The programme started in 1992/93 and is ongoing. While some of the original recipients have stopped receiving, the majority continued to receive inputs, and will probably continue to do so in the next few years if the programme continues. Most of the farmers have received inputs for at least 3 seasons (see Fig 3.5) Some farmers have become permanent recipients and beneficiaries of the programme.
All categories of farmers are represented, from the tractor owning to those without any cattle. Even those employed participate in the programme . The crop pack programme, then, is a well established and broad based programme; it is not a marginal one.
a) Evidence of the Adoption of new Technologies.
Before examining the evidence of increased adoption of inputs by farmers, it is necessary that the evaluation briefly examines the `pre - crop pack agriculture’. The following points can be said about this agriculture:-
- Some 77.1 percent (466) of the people interviewed knew the use of fertilisers. The remainder did not use chemicals at all. In the survey those who never used inputs comprised 23.9 percent (144) of the farmers.
- Even among the users of fertilisers there were some who did not regularly use it. These irregular users tended to be generally sceptical of chemicals and to have limited knowledge of its functions.
[continue reading on page 33]
[page-number of print-ed.: 32]
Figure 3.5: Classification of Recipients By No. of Times Receiving Inputs
Source: Evaluation Data, 1997
[page-number of print-ed.: 33]
- Some farmers used modern seed varieties, while others used traditional ones. Although traditional varieties were drought and pest tolerant, they tended to yield very little output. These farmers tended to have poor knowledge regarding hybrid seeds and some did not know of the high yielding seeds.
- While some farmers relied on cash crops such as cotton, sunflower and maize, others grew traditional subsistence crops only, namely sorghum and millet. The latter group comprised tenth of the farmers.
This scheme is rather limited because it does not capture the full range of practices that took place before the crop pack programme. It does not, for instance, show how farmers traded or shifted from one agricultural category (subsistence) to another (commercial) depending on availability of income. Notwithstanding this, the schema approximates what transpired before the introduction of the crop pack programme.
With this in mind, the report can begin to address the question about whether there is any noticeable adoption of the technologies by farmers. The evaluation team noticed a number of things regarding technology adoption. The first is a report by over 20 percent of the farmers who never used fertilizers that they are now using. A small portion of the farmers who previously used fertilisers to a smaller extent said that it now fully utilises them. The percentage of farmers or people owning that the programme provided hitherto unknown vital knowledge on fertilizers is 59.2 percent (356) of the people. Over half of the farmers said that they now have more knowledge of new seed varieties, and that they arenow using these new varieties.
Thus although there is portion of farmers who regard the crop pack as useless, it is clear now that this programme has achieved a dual function:-
- It has exposed farmers to new technologies. In some
[page-number of print-ed.: 34]
instance it has enhanced existing knowledge regarding agriculture.
- It has influenced farmers to accept new technologies.
- Farmers fear for being prosecuted.
- It is socially embarrassing to publicly admit eating treated seeds. Many households still feel embarrassed to be known that they are hunger stricken; and
- Farmers fear being denied access to seeds in the future.
There are many other reasons why farmers refuse to admit that they consume proffered seed inputs, but these are the most important.
- how timely is the delivery of inputs?
- how appropriate are the proffered inputs?
- how sufficient are the inputs?
- does government consult farmers with regard to the inputs given?
- Six districts employed the principle that each adult person was a beneficiary;
- Four districts employed the principle that active farmers were the real beneficiaries;
- Two districts limited input benefits to Zimbabwean citizens;
- Two districts limited inputs to the needy;
- Three districts defined beneficiaries as anybody wanting to participate in the programme; and
- One district limited benefits to all lucky farmers, through the casting of lots.
- In the 1993/94 season more than half of the districts received their inputs after the rainy season had started.
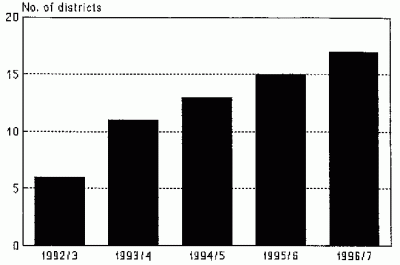
- In 1994/95 the majority of the districts (11) received their inputs after October.
- In 1995/96 over 75 percent of the districts received their inputs after October.
- In 1996/97 85 percent of the district received their inputs from November onwards.
- only 5 districts regarded the maize given to them as inappropriate. It is not at all clear whether it was the crop or the variety itself which was not appropriate.
- only 3 districts complained on the suitability of small grains. Again its not clear whether it was the varieties they used or whether it was the crop itself.
- One district said the fertilizer was not appropriate.
- all farmers report having no surplus seeds and chemicals;
- in certain districts, farmers, insulted by the meagre nature of the inputs, turned down offers to collect their share.
- At least 10 of them did not agree that their function was to identify beneficiaries;
- Two committees categorically rejected any association with organisation of input allocation; and
- Three committees refused the role of maintaining order at distribution points.
- government provided farmers with inappropriate types of inputs. Areas such as Plumtree and Chiredzi, continued to receive maize and related chemical inputs which were not suitable to the area;
- government provided meagre inputs to farmers; and
[page-number of print-ed.: 53]
- government provided inputs at the wrong time.
Before moving to issues of consumption of seeds and selling of inputs, it is fitting to address the question regarding why farmers are adopting new technologies.
b) Reasons for the Adoption
Farmers interviewed do not report that they adopted the new inputs because of the absence of their traditional ones. The concerned farmers report that the new technologies are beneficial to them: here they mean that the new seed varieties yield more than the old ones, that they fetch more money than the old ones, etc. These farmers adopt the technology for this reason alone. Those farmers who refuse to accept the new technology say that they are not beneficial to them (section 3.4). Here they mean that the technology does not improve production at the household level. But more will be said about this in a later section.
c) Consumption and Selling of Inputs
Interviewed households are not keen to say that they consumed seed packs. The reasons for this denial are obvious:-
[page-number of print-ed.: 35]
When it is understood that farmers publicly deny eating seeds, the report can begin to look at whatever statistics confirming this trend as a tip of an ice berg.
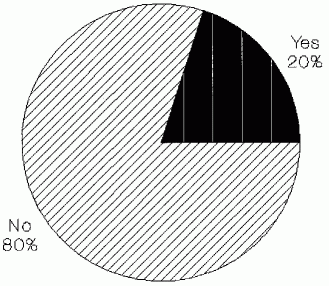
The evidence of farmers eating seeds comes from district distribution committees (see Fig. 3.6). These committees generally reported widespread eating of seeds within their districts. Altogether a quarter of the district committees report cases of farmers consuming seeds in their area. Precisely for the two reasons discussed above, it is suspected that the actual percentage is more than this.
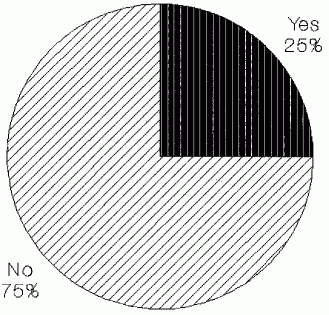
There is a related issue with regards to farmers selling seed packs. Very little confirmation is forthcoming from individual households themselves that they sold these inputs. This is not surprising since farmers fear being prosecuted and denied access to seeds in the future distribution. The only evidence comes from the district distribution committees (see Fig 3.7) These report a widespread sale of inputs. Altogether, committees agreeing that their districts participated in the sale of seed packs, come to five , which is a quarter of the sample. Again since the sale of seeds is thought of as criminal, it is suspected that the percentage is a gross underestimation and that the actual number of cases is more than this.
With these remarks, and others which have appeared in the press, the report can now proceed with the full knowledge that crop packs are being sold and consumed by some of the farmers. The section below examines the reasons for crop pack consumption and sale.
[continue reading on page 38]
[page-number of print-ed.: 36]
Figure 3.6.: District Reporting Cases of Seed Consumption
Source: Evaluation Data, 1997
[page-number of print-ed.: 37]
Figure 3.7.: Districts Reporting Cases of Seed Sale
Source: Evaluation Data, 1997
[page-number of print-ed.: 38]
d) Reasons for Sale and Consumption
Generally, those administering the programme attribute the sale or consumption of inputs to ignorance of the farmers. Other times, the administrators attribute this to the wickedness on the part of the farmers. Interviewed farmers suggested more compelling reason why farmers commit such unacceptable acts. Interviewed respondents reported that they sell the inputs out of poverty. This view is quite intelligible, considering rural poverty which is getting worse on account of the structural adjustment programme. Inputs are some of the items which can be sold to raise money for other necessities. Other interviewed farmers said that they sold inputs on account of their inappropriateness. A tenth of the distribution committees also supported this point. Since the report will, in later sections, address in detail the issue of input appropriateness and its effects on smallholder agriculture, let it suffice to sketch the major points supporting what farmers said. Current practice by government, especially in most recent seasons, is to give standard inputs to farmers. Thus maize is given to all districts notwithstanding the agro-ecological conditions. Fertilisers are advanced to all areas, regardless of their ecology. In the programme inputs are not matched to areas. The survey does not know the reasons for this standardised approach. Perhaps government wants all areas to grow subsistence crops which boost food security in the country or perhaps to grow commercial crops which promote export market. Perhaps, it is cheap to procure standard inputs; perhaps, appropriate inputs are not available nationally. These are all speculations. Whatever the reason for it, this standardised approach results in farmers being given inputs whose only value is best realised through sale to those other farmers in need of them.
With regard to the consumption of seeds, district committees gave one single reason - hunger. This reason is quite plausible: as mentioned before, rural poverty is increasing daily on account of the structural adjustment programme. In addition, failed rainfall or its abundance is causing thousands of households to be without food. The grain loan scheme - where it operates- is largely inadequate. All this leaves farmers hungry, and ready to eat rather than plant available seeds.
[page-number of print-ed.: 39]
The evaluation report concludes this section with a few remarks. It is true that farmers are both eating and selling inputs, perhaps in all districts. This practice does not mean that farmers do not really appreciate the new technologies. It only means that farmers are in a dilemma where they are pressured by circumstances into making what appears to be irrational decisions. Hunger forces them to eat seeds, while the general shortage of money to buy other essentials tempts them to sell whatever can be sold, including donated inputs. The team is convinced that the sale and consumption of inputs is an issue which proper policy planning and co-ordination can easily sort out. For example, giving adequate grain loans will simultaneously undercut the need to eat and sale inputs.
3.4 The Efficiency of the Programme in input Targeting, Management and Distribution
Matters of input targeting, management and distribution are as important as their availability. If there is poor targeting, if the seeds are inappropriate, if there is poor timing, it is likely that the programme will fail to attain its objective of rehabilitating small scale agriculture. What is ideal is that the inputs be appropriate, adequate, well timed and targeted to the needy. This section examines the efficiency of the programme in input targeting, management and distribution. In particular, it addresses some of the following questions:-
a) Inputs and Targeting of Farmers.
When government conceived the programme, the plan was to assist smallholder farmers whose agriculture could not recover on its own. The government did not plan to provide inputs to the
[page-number of print-ed.: 40]
well endowed farmers - ie. those employed and rich farmers. Its plan was to provide fertilisers, and seeds to those whose only resources were wiped by the drought.
The evaluation team observed a gap between what the government espoused and what happened on the ground. Distribution committees did not in the main target the needy as sole beneficiaries. These distribution committees devised their own selection criteria. Below we have broken down the districts by the wording of their `criteria’.
Despite the differences in criteria wording, these committees share a common desire to extend benefits to everybody in the area. The criteria captured almost every living and interested farmer into the net of the crop pack programme; within the survey only 2.8 percent did not receive the inputs. The rest, 97 percent, received inputs (see also Fig 3.4). The evaluation team suspects that 2.8 percent voluntarily chose not to take part in the programme, perhaps because they are gainfully employed to care about agriculture. Thus although district committees operated with some criteria, theirs radically differed from that espoused by government.
[page-number of print-ed.: 41]
The failure to stick to the government principle that only the needy should benefit had wider ramifications on the efficacy of the programme. The analysis looks at these in detail in the following section. For now it should be pointed out that the inflated recipient lists resulted in small 'dividends' for all. For the well to do, the shares were probably a welcome supplement to their household resources. To the poor, the 'shares' were no doubt insufficient to warrant a recovery of agriculture. The evaluation team does not have answers why distribution committees deviated from the government held principle of targeting the need. It speculates, however that the committees may have been pressured by powerful politicians or Party members who saw political benefits in broadening the recipient base. Whatever the actual reasons for including everybody in the programme, it remains undisputed that the practice denied the needy beneficiaries of adequate inputs which warranted a prompt recovery of their agriculture.
b) Timing of Inputs.
Where agricultural inputs are to be useful to the farmers, it is necessary that these be timely delivered. Whoever is intervening must make sure that the inputs are given to the farmers well in advance of the planting season. In areas where the planting season is short, and where rainfall is not predictable, this becomes even more important. When seeds and fertilisers are promptly delivered, it allows the farmer to take advantage of the early rainfall. But how far did the programme strive to deliver inputs in time?
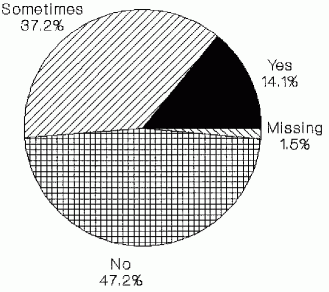
The evaluation team came across encouraging cases where farmers received their inputs well in advance of the planting season. In the survey, the percentage that expressed satisfaction in the delivery of inputs was an 8.5 percent. This group which comprised less than a tenth of farmers thanked the government for this prompt delivery.
The majority of the people (91.5%), however complained about delays in input arrival (see Fig.3.8 and 3.9). Often these inputs arrived well after the planting season, sometimes in January or
[page-number of print-ed.: 42]
even February. That inputs arrived generally late can be appreciated from the following evidence and revelations:-
Clearly almost all the districts experienced a delay in the arrival of their inputs. It must be recalled that the report is talking here of the inputs arriving late at the distribution point. The actual distribution to the farmers, probably took place weeks after the date of input arrival at the distribution point, meaning that farmers received their share very late in the season.
Where inputs arrived late, some farmers understandably rejected collecting them. Two of the district distribution committees reported that their farmers, at least some of them, turned down calls to collect their share. Perhaps the farmers did not want to end up paying transport for crop packs which they would not use at all. Other farmers collected the delayed inputs, and put them to other uses such as eating and selling them (confer Section 3.3). It is clear therefore that inputs arrived late to the farmers. When this happened, farmers either refused to collect them. Where farmers collected the delayed inputs, they invented new purposes for them. Where the inputs arrived late, farmers were left to depend on their own resources. Once again, poor farmers felt hardest the pinch since they lacked alternative sources of input.
[continue reading of page 45]
[page-number of print-ed.: 43]
Figure 3.8: Timely Arrival of Inputs
Source: Evaluation Data, 1997
[page-number of print-ed.: 44]
Figure 3.9: No. of Districts Receiving Inputs After October
Source: Evaluation Data, 1997
[page-number of print-ed.: 45]
c) Advance Notice
Advance notice of what inputs they will get is important to farmers. It allows them to plan ahead. If the promised seeds demand additional inputs, forewarned farmers can begin planning to buy these. If the farmers are told in advance of the magnitude of the inputs, farmers can start thinking of ways to augment these donations. If the promised seeds are of a single crop, farmers may need to know what it is and its variety, so that they may know which other crops to buy. This section examines the extent to which the programme notified farmers in advance regarding the nature of the inputs.
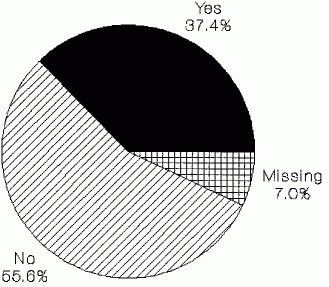
The evaluation team discovered that there were cases in which farmers were told in advance about the nature and quantities of inputs they would receive. As many as 37.4 percent of the farmers reported that they were notified. These farmers certainly started planning on the basis of this information. The other two-thirds of the respondents however denied this (see Fig 3.10). It is suspected that these farmers were not able to plan for their agriculture. Probably some used the money to buy crops which government supplied a few months later; others probably used their money to buy other things, not knowing that they would get limited quantities of seeds. The range of inconveniences is large, and to dwell on them would be pedantic. Suffice to say that the programme, by failing to notify the farmers of the nature and quantities of crops, created planning problems at the household level.
d) Appropriateness of Inputs.
For any crop pack programme to be beneficial it must be appropriate. The seeds advanced to the farmer must be suited to the environment. The seeds must be high yielding, yet pest tolerant or even resistant.
The crop from the seeds must be readily marketable where it is not consumed. The chemicals advanced must facilitate the growth of plants, rather than their wilting or drying up. An
[continue reading on page 47]
[page-number of print-ed.: 46]
Figure 3.10: Advance Notice on Inputs
Source: Evaluation Data, 1997
[page-number of print-ed.: 47]
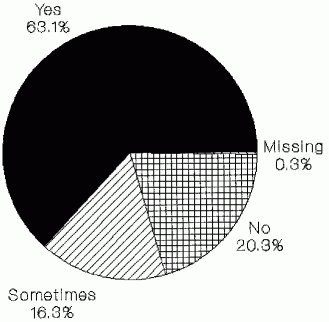
appropriate input is therefore one that achieves its effect without simultaneously creating problems for the farmer. With this definition in mind the evaluation may now proceed to examine how appropriate the programme was. In general the majority of the farmers felt that all inputs were appropriate (see Fig 3.11). Over three quarters of the respondents echoed this view. Only one - quarter felt that the inputs were not appropriate. Broken down by district, the same general pattern appears:-
Clearly government's choice of inputs of whatever crop and chemicals is commendable. What is not commendable is the belief that all crops apply for all areas. When farmers are given inputs which do not work, they sometimes refuse to collect them. Sometimes they sell them to buy other essentials. Section 3.3 has provided ample evidence to this assertion. But most of the times farmers grow these, only to harvest nothing. The government needs to develop ways of knowing which crops are appropriate for specific area.. It is only when it can match crops to areas, and not vice versa, that its farmers can recover from the effect of the drought.
e) Quantities of Inputs
The quantities of inputs given to the farmer are crucial in determining his harvest levels. When a farmer is given small quantities of seeds, his output is generally insignificant. Conversely, where inputs are of a substantial amount, the farmer realizes significant outputs, all things being equal.
[continue reading on page 49]
[page-number of print-ed.: 48]
Figure 3.11: The Approriateness of Inputs
Source: Evaluation Data, 1997
[page-number of print-ed.: 49]
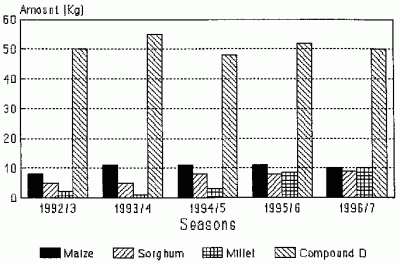
The evaluation team found out that while nearly everybody received inputs, the shares were rather scanty. To be sure, there were cases where farmers received as much as 20kg of seeds. But these were the exception rather than the rule (see Figure 3.12). On average, farmers received 10kg of seeds. The average figure fell as one progressed to the smaller grains. This obviously shows government’s bias - a common phenomenon in Africa- towards commercial crops such as maize. But perhaps maize seed was the only available seed in the market. The same pattern holds for chemicals (AN and Compound D), where on average, farmers received a bag for each type. That the inputs advanced were insufficient is borne by the following points:-
The crop pack programme is certainly not meant to be a mechanism through which farmers make huge profits. Its main function is to assist farmers to be on their feet. The programme is also not meant to substitute individual initiative and support individual responsibility with that of the Government. For this reason inputs have to be small. But to give farmers an average of 5 kilograms of sorghum as seeds and to expect them to perform better is to expect a difficult thing. Similarly, to expect a farmer to do better with one Compound D bag is not only unrealistic but `extremely insulting’ as one bitter farmer observed. To guarantee a recovery of small holder agriculture input amounts must break the existing levels.
f) Level of Government Consultation
Farmer consultation is arguably the most important thing in rural development. It allows those intervening to know the needs of the rural farmers. When a government consults farmers on their needs, it is able to initiate agricultural projects which are appropriate. The evaluation team sought to examine whether government in the crop pack programme consulted the farmers on what crops to give, the quantities and the dates for reception.
[continue reading on page 51]
[page-number of print-ed.: 50]
Figure 3.12: The Average Amount of Inputs Received By Season
Source: Evaluation Data, 1997
[page-number of print-ed.: 51]
The findings of the evaluation team was that generally government had put in place consultative useful mechanisms through Agritex and/or Zimbabwe Farmers' Union.But the distribution committees reported that there was minimal, if ever, consultation by the government.
g) Distribution Committees.
These are organisations composed of government, state, non governmental organisations, modern and traditional leadership (Table 2.3). The government representatives are mainly from the Agritex department, There are also representatives from the Minstries of Local Government and Education. State representatives include the Police and the Party. Local representatives include both specially elected leadership and councillors.
These committees' function is to facilitate orderly distribution of inputs to farmers. Another function, perhaps more important, is to channel local needs to the government: they tell government about their input preferences. Two things can be said about these committees. Some of them did not understand their functions at all as is evident from the following:-
All these observations - a fact which amounts to denial of their official responsibilities- cast doubt on whether these distribution committees understood their roles; no wonder why we had chaos in the definition of the beneficiary.
The second point to say about these distribution committees is that some of the members constituting them were not suited to
[page-number of print-ed.: 52]
their roles. Assuming that the role of the committee is not just to distribute inputs but to discuss the appropriate ones with government, what use is there in having a police officer, or a member of the Party in the committee? Are these officers knowledgeable in agriculture?. The evaluation team does not think so. In fact the team goes to suggest that some of the members were more of a constraint than a resource. It is likely for instance that those members from the Party leadership, seeing a political mileage from democratizing access to inputs, influenced their own committees to target everybody.
It was argued above that the distribution committees are practically ill-suited to the job. But even if they were the right institution, it is unlikely, that this would have made any change. The government throughout the entire period generally did not consult the committees on the amounts and type of inputs . Only three districts were consulted on the type and quantity of inputs to be received. The rest were not consulted at all. All those farmers from the districts where consultation took place generally say that no meaningful change followed these consultations.
That the government failed to consult farmers regarding their input and quantity preference is part of the problem. The other is that government rarely told farmers in advance about the nature and quantities of the crops they would receive. In the survey, only 38.8 percent reported that government had made known in advance its decision regarding input types and when they would be delivered. The rest of the respondents said they only knew of the nature of the packs on the distribution day.
In closing, it is pertinent to briefly summarise the effect of government’ practice of making unilateral input decisions. The results of not consulting farmers were that:-
The result of not notifying farmers about the type and quantities was understandably tragic. Farmers were unable to plan for their activities. Thus it is more likely that some of the affected farmers bought certain inputs, only to have government supplying the same.
Before ending this section it is necessary to say something in defense of the government and those who implemented the programme. The first point is that the Government was, following the drought, faced with a crisis which it felt demanded swift action. The Government felt that farmers must get aid of some sort, however little. There was no time to waste on consultation: the end justified the means. Any problems would be looked at after the intervention. Thus out of a desire to assist, government ignored those processes,such as consultation, whose adoption would have enabled it to know about the inputs and their timing preferred by farmers. From this view, government ought to be appreciated and not criticised - this is more applicable at least in the implementation of the programme during the first season in 1992/93. Timeous resource availability on the part of government to finance the programme was also a major obstacle constraining the Ministry of Agriculture from advance consultation with the farmers.
© Friedrich Ebert Stiftung | technical support | net edition fes-library | Januar 2002


